 |
JDFTx
1.1.2
|


|
|
JDFTx
1.1.2
|
|
To do: Link this with a sequence of previous tutorials, and add more details where appropriate
First lets specify the common specifications for bulk silicon:
#Save the following to common.in:
lattice face-centered Cubic 10.263
ion-species GBRV/si_pbe_v1.uspp
elec-cutoff 20 100

ion Si 0.00 0.00 0.00  0
ion Si 0.25 0.25 0.25  0
and a total energy calculation:
#Save the following to totalE.in:
include common.in
kpoint-folding 8 8 8    #Use a Brillouin zone mesh
electronic-SCF          #Perform a self-consistent calculation
dump-name totalE.$VAR
dump End ElecDensity    #Save the self-consistent electron density
which we run with
jdftx -i totalE.in | tee totalE.out
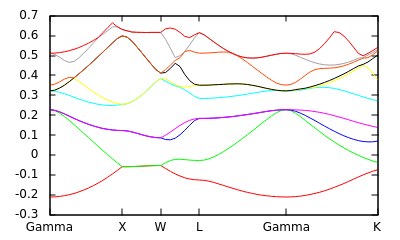
Next, we list high-symmetry points in the Brillouin zone laying out the path along which we want the band structure:
#Save the following to bandstruct.kpoints.in
kpoint 0.000 0.000 0.000     Gamma
kpoint 0.000 0.500 0.500     X
kpoint 0.250 0.750 0.500     W
kpoint 0.500 0.500 0.500     L
kpoint 0.000 0.000 0.000     Gamma
kpoint 0.375 0.750 0.375     K
and generate the high-symmetry path and a band structure plot script using a script distributed with the jdftx source:
bandstructKpoints bandstruct.kpoints.in 0.05 bandstruct
This should generate a file bandstruct.kpoints containing kpoints along the high-symmetry path and a GNUPLOT script bandstruct.plot. The second parameter, dk, of bandstructKpoints specifies the typical distance between kpoints in (dimensionless) reciprocal space; decreasing dk will produce more points along the path, which will take longer to calculate, but produce a smoother plot. Note that the last column of banstruct.kpoints.in is a label for the special Brillouin zone point which is used to label the plot.
Now we can run a band structure calculation along this path with the input file:
#Save the following to bandstruct.in
include common.in
include bandstruct.kpoints         #Get kpoints along high-symmetry path created above
fix-electron-density totalE.$VAR   #Fix the electron density (not self-consistent)
elec-n-bands 10                    #Number of bands to solve for
dump End BandEigs                  #Output the band eigenvalues for plotting
dump-name bandstruct.$VAR          #This prefix should match the final paramater given to bandstructKpoints
which we run using:
jdftx -i bandstruct.in | tee bandstruct.out
which produces bandstruct.eigenvals, which you can plot using the auto-generated GNUPLOT script bandstruct.plot to get the figure shown above.
 1.8.11