This tutorial illustrates how to calculate the dielectric tensor of a material. We will use the Silicon crystal as an example. We first run a self-consistent energy density calculation. Save the following in totalE.in
lattice face-centered Cubic 10.263
ion-species SG15/$ID_ONCV_PBE.upf
ion Si 0.00 0.00 0.00  0
ion Si 0.25 0.25 0.25  0

kpoint-folding 6 6 6
elec-cutoff 20 100
elec-n-bands 20
electronic-SCF

dump-name totalE.$VAR
dump Init Symmetries Kpoints
dump End  BandEigs Fillings Momenta
and run it using:
mpirun -n 4 jdftx -i totalE.in | tee totalE.out
This generates the kpoints (totalE.kPts and totalE.kMap), the symmetries (totalE.sym), the energies (totalE.eigenvals), the momentum matrix elements (totalE.momenta) and the occupations (totalE.fillings).
Now you can use the post-processing script epsilon included in JDFTx to compute the dielectric tensor of Silicon.
This script contains the following input flags:
--omegaMin OMEGAMIN  Starting frequency of the energy grid [eV]. Default=0.0
--omegaMax OMEGAMAX  Frequency cutoff for the energy grid [eV]. Default=0.0
--n_omega N_OMEGA    Size of the energy grid. Default=1
--gamma GAMMA        Gaussian broadening parameter [eV]. Defualt=0.2
--prefix PREFIX      Prefix of DFT outputs. Default=totalE
To compute the dielectric tensor for Si, run the following:
epsilon --omegaMin 0.0 --omegaMax 30.0 --n_omega 500 --gamma 0.2
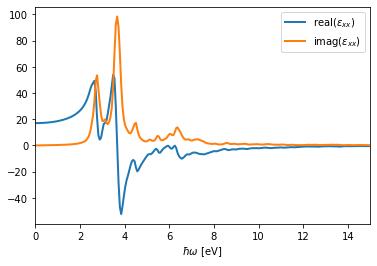
This generates 9 dat files, each contains one of the dielectric tensor components. In each file, the first, second and third columns are the frequency [eV], real(epsilon) and imag(epsilon), respectively.
We can plot the real and imaginary parts of epsilon using Python:
import numpy as np
import matplotlib.pyplot as plt

data = np.loadtxt("eps_xx.dat")
plt.plot(data[:, 0], data[:, 1], label="real($\epsilon_{xx}$)", lw=2.)
plt.plot(data[:, 0], data[:, 2], label="imag($\epsilon_{xx}$)", lw=2.)

plt.xlim(0., 15.)
plt.xlabel(r"$\hbar \omega$ [eV]")
plt.legend()
plt.savefig("epsilon.jpg", bbox_inches='tight')